DATAVIEW
DATAVIEW
Overview

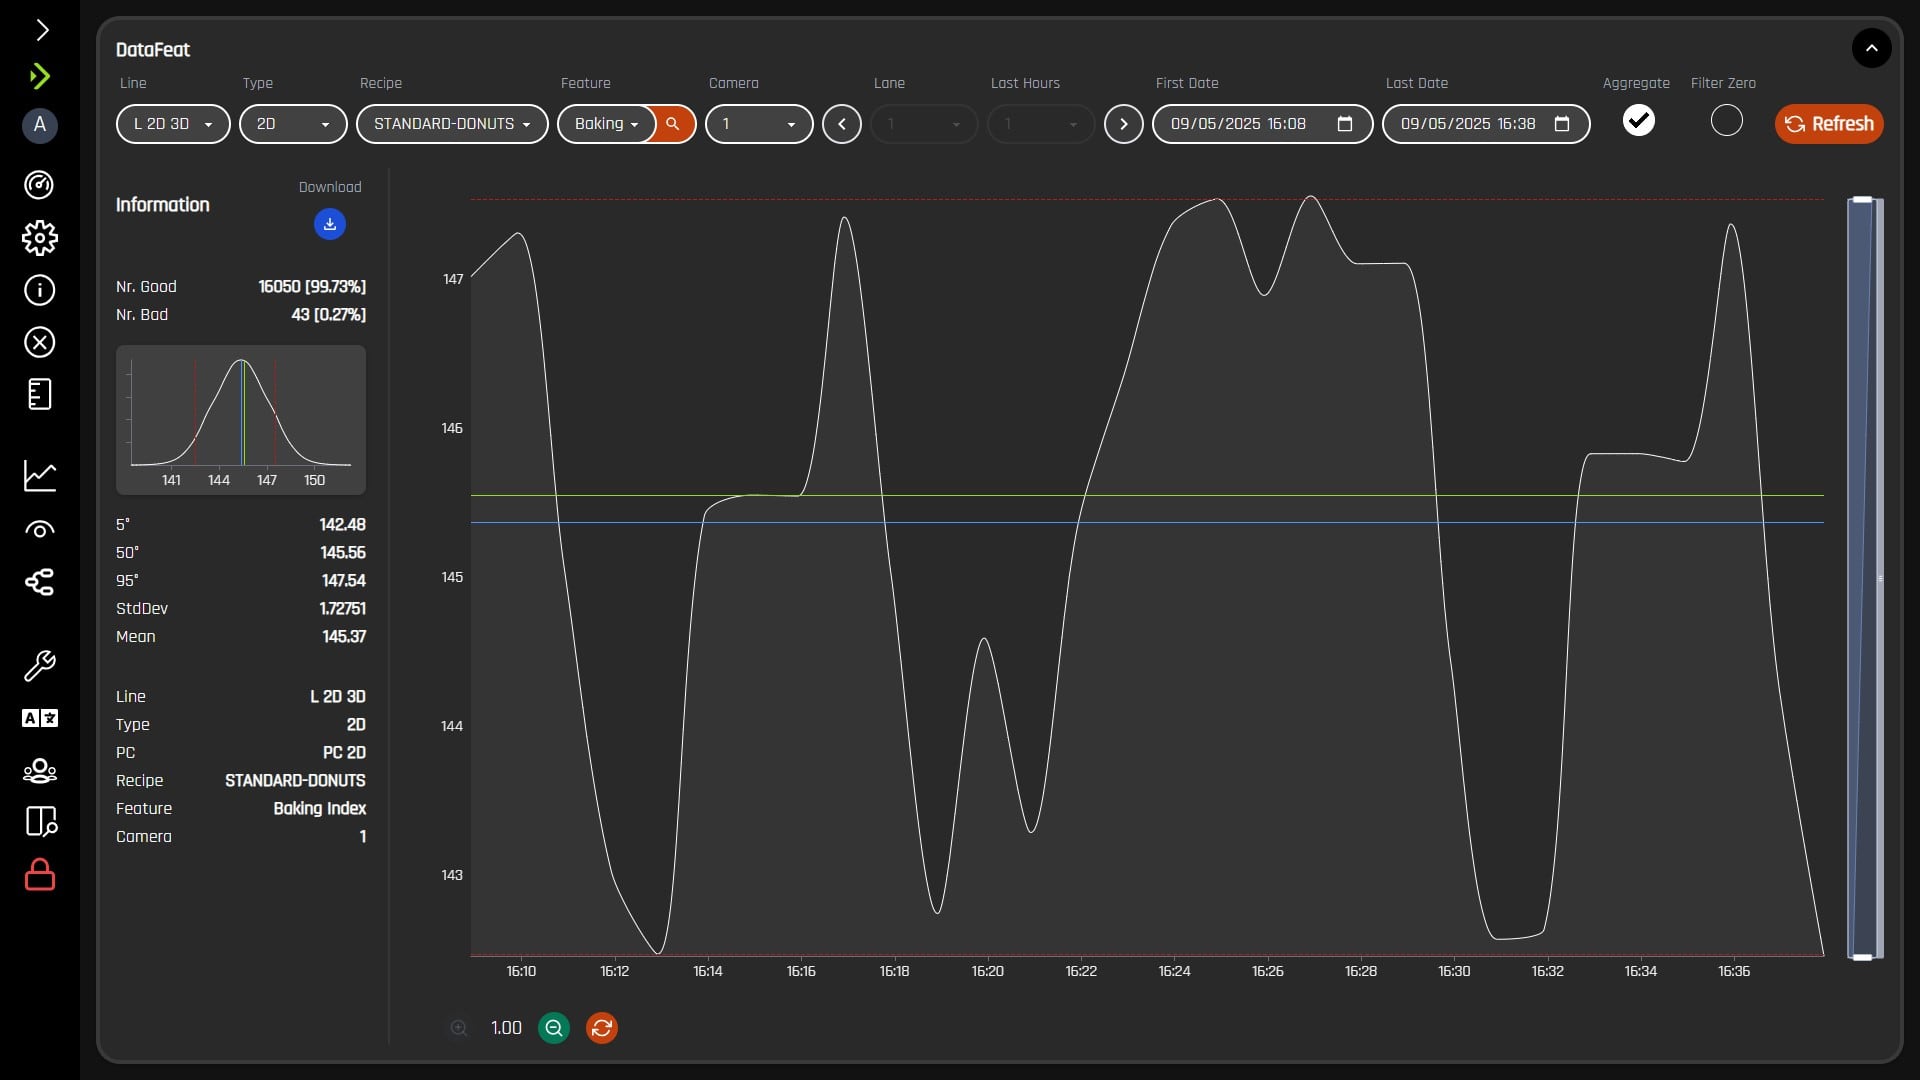
DATAVIEW offers descriptive analytics tools with comprehensive reports and real-time graphs, providing a clear overview of all collected data over customizable time periods. By activating the license, users can also access real-time dashboards and intelligent alerts that empower operators with instant feedback, early anomaly detection, and guided corrective actions.

Sensure

DATAVIEW can be implemented not only at the line level but also integrated at the plant level, enabling a plant-wide overview by accessing and comparing trends across multiple process lines. Furthermore, it can be scaled to the corporate level, allowing performance and quality analysis across multiple plants for a comprehensive, global view.

The DATAVIEW license includes the following enabled functions:
Main features
Sensure
  • Comprehensive set of data analysis tools, including statistical charts with customizable timeframes and filters (by features, shifts, lanes, etc.), for detailed production and defect detection analysis (including explanations of rejection causes, images of all defects, and more).
  • Data export in multiple formats, such as PDF, text, Comma-Separated Values (CSV), Microsoft Excel, and JSON, enabling seamless integration with other systems and additional analysis.
  • Customizable reports can be automatically sent via email at regular intervals to defined users.
  • License pre-installed on a dedicated IPC, with the option to manage data backups on company servers or in the cloud.
  • Fully customizable upon request.
Sensure
Real-time
Dashboard
  • Maximize data visibility and impact by creating customized views, real-time gauges, and insights displayed on televisions or monitors strategically placed throughout the production line or plant. If required, integrate various types of alarms, including messaging, audible alerts, visual lights, etc.
Sensure
Intelligent
alert system
  • Intelligent alert system to notify operators in case of specific events or warnings. When triggered, the system provides operators with recommended actions (checks and instructions), predefined based on a root cause analysis diagram. The “Easy Alert Setup” tool enables customization of messages (checks and instructions) based on measured values for different features.
  • Alerts and data are displayed on the Vision GUI, on televisions/monitors strategically placed throughout the production line or plant, or on any device connected to the network, including desktops, tablets, and smartphones.